
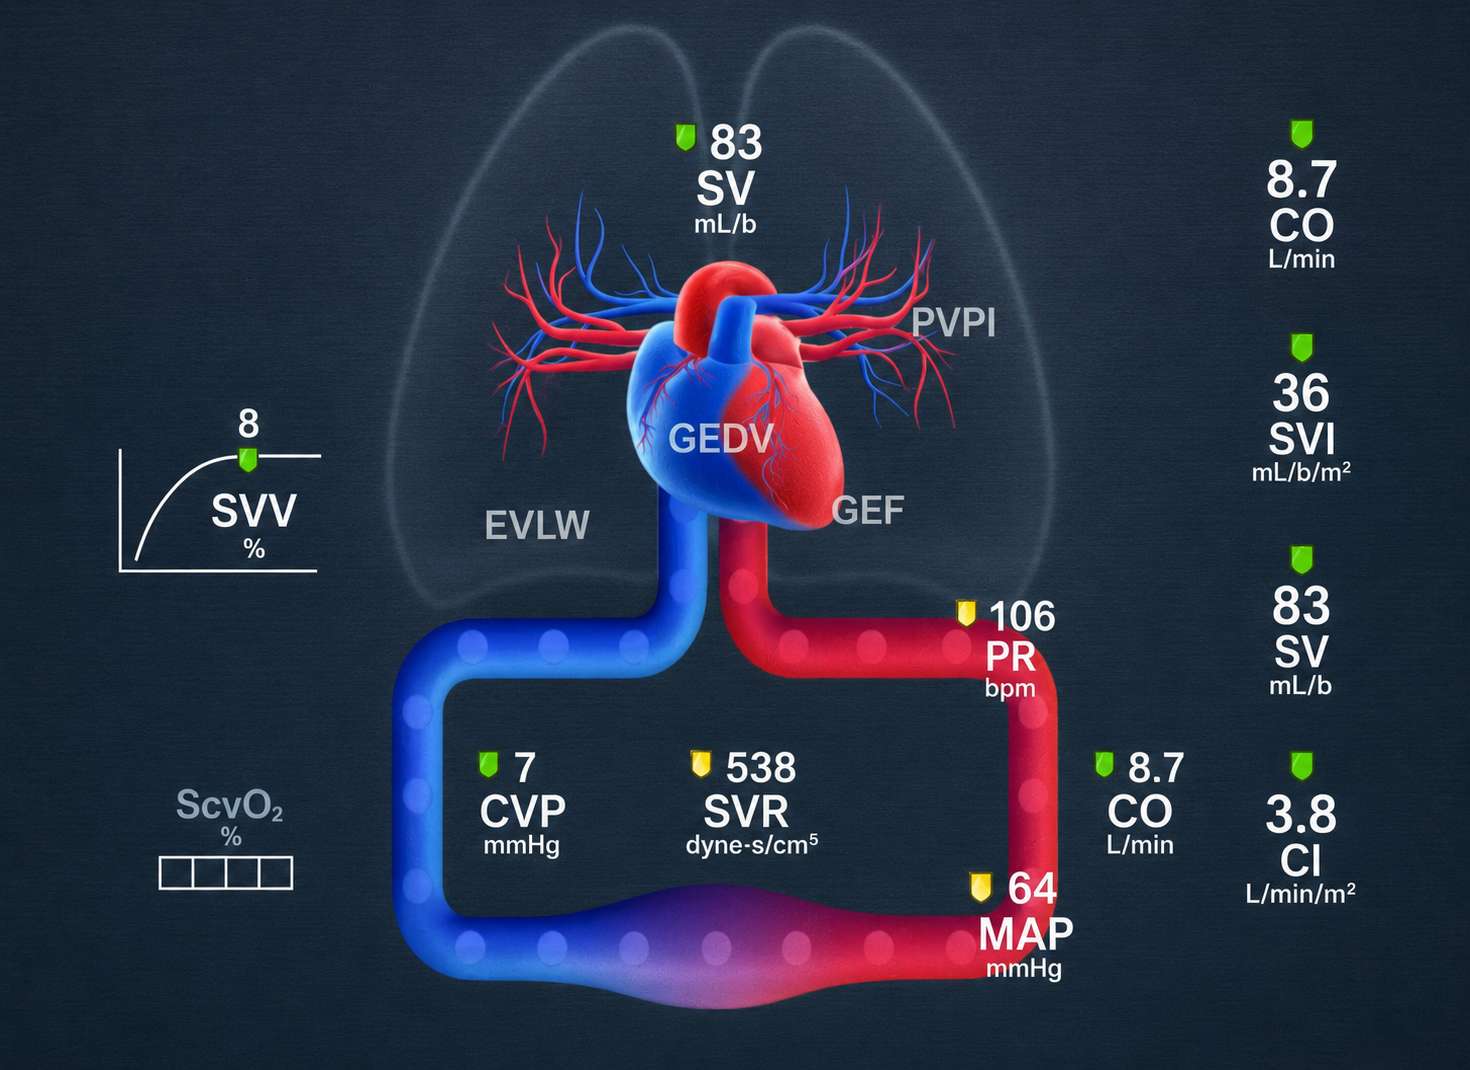
One of the easiest mistakes to make when learning shock is to associate it with hypotension.
Low blood pressure certainly can occur in shock, but shock is not defined simply by a low blood pressure. Shock is fundamentally a state in which the cardiovascular system is unable to deliver enough oxygenated blood to meet tissue demands. [1,2]
A patient can therefore be in shock while maintaining what appears to be an acceptable blood pressure. Conversely, a patient can have a relatively low blood pressure while still maintaining adequate tissue perfusion. [1,2]
That distinction matters because when we focus only on the blood pressure, we are looking at the result rather than trying to understand the physiology producing it.
A better way to approach shock is to ask three questions:
What is happening to preload?
What is happening to afterload?
What is happening to cardiac output?
If we understand those three variables, the different forms of shock become considerably easier to understand.
First, Understand the Three Variables
Before comparing the different shock states, we need to understand what we are actually talking about.
Preload
Preload is essentially the degree of ventricular filling and myocardial stretch immediately before contraction. [3]
Clinically, we often simplify this and think of preload as the amount of blood returning to and filling the heart.
That simplification is useful, provided we remember that preload is influenced by much more than circulating volume alone. Venous tone, intrathoracic pressure, ventricular compliance, right ventricular function, mechanical ventilation and obstruction to blood flow can all influence ventricular filling. [2,3]
For practical purposes:
Less venous return → less ventricular filling → lower preload.
Afterload
Afterload is the load or resistance the ventricle must overcome to eject blood. [3]
For the left ventricle, systemic vascular resistance is often used as a practical approximation of afterload, although the true physiology is more complex.
When systemic vessels constrict, resistance increases.
When systemic vessels dilate, resistance decreases.
So, as a clinical simplification:
Vasoconstriction → increased afterload.
Vasodilation → decreased afterload.
Cardiac Output
Cardiac output is the amount of blood the heart pumps each minute.
It is determined by heart rate and stroke volume: [3]
Cardiac Output = Heart Rate × Stroke Volume
Stroke volume itself is influenced by preload, contractility and afterload. [3]
This is why changes in circulating volume, myocardial function and vascular resistance can dramatically alter cardiac output.
And this brings us to shock.
Hypovolemic Shock: The Tank Is Empty
Hypovolemic shock is probably the easiest form of shock to visualize.
The cardiovascular system simply does not have enough circulating volume. [1,4]
That may result from hemorrhage, severe gastrointestinal losses, burns, dehydration or other causes of significant intravascular volume depletion. [4]
As circulating volume falls, venous return decreases.
Less blood returns to the heart.
Less blood enters the ventricles.
Therefore:
Preload ↓
With reduced ventricular filling, stroke volume falls. The body initially attempts to compensate by increasing heart rate and contractility, but if volume loss continues, those mechanisms become insufficient. [1,4]
Eventually:
Cardiac output ↓
The body recognizes the reduction in effective circulation and activates the sympathetic nervous system. Peripheral blood vessels constrict in an attempt to maintain arterial pressure and redistribute blood toward essential organs. [1,4]
Therefore:
Afterload/SVR ↑
The expected pattern becomes:
HYPOVOLEMIC SHOCK
Preload ↓ | Afterload ↑ | Cardiac Output ↓
But notice something important.
The increased afterload isn’t the original problem.
It is compensation for the problem.
The body is attempting to preserve perfusion despite a falling stroke volume. [1,4]
Cardiogenic Shock: The Pump Is Failing
Cardiogenic shock is almost the opposite problem.
The tank may contain blood, but the pump cannot effectively move it forward.
Consider a patient with severe left ventricular dysfunction following a large myocardial infarction.
Blood returns to the heart, but the damaged ventricle cannot generate an adequate stroke volume.
Forward flow falls.
Therefore:
Cardiac output ↓ [1,5]
Because the ventricle cannot effectively eject its contents, pressures rise behind the failing chamber.
With left ventricular failure, this can increase left-sided filling pressures and pulmonary venous pressure, contributing to pulmonary congestion and pulmonary edema. [5]
Therefore, the typical cardiogenic pattern is:
Preload ↑
The body then recognizes the falling cardiac output and activates sympathetic vasoconstriction in an attempt to maintain blood pressure. [1,5]
Therefore:
Afterload/SVR ↑
The classic pattern becomes:
CARDIOGENIC SHOCK
Preload ↑ | Afterload ↑ | Cardiac Output ↓
And this explains an important clinical problem.
The failing heart is already struggling to eject blood, yet the body’s compensatory response increases systemic vascular resistance.
In other words, the heart becomes weaker while the resistance it must pump against becomes greater.
This is why blindly treating the blood pressure without understanding the underlying hemodynamics can sometimes make the physiology worse.
Distributive Shock: The Container Became Too Large
Distributive shock is fundamentally different.
Instead of losing the circulating volume or losing the pump, vascular tone is lost. [1,4]
The classic example is septic shock.
Inflammatory mediators produce widespread vasodilation. The vascular space effectively becomes larger relative to the amount of circulating blood contained within it. [4,6]
At the same time, increased capillary permeability can allow fluid to move from the intravascular space into the interstitial space. [4,6]
The patient may therefore have an apparently reasonable total body fluid volume while having inadequate effective circulating volume.
Venous return may fall.
Therefore:
Effective preload ↓
Because the systemic vasculature is dilated:
Afterload/SVR ↓
Now something interesting happens.
Early in septic shock, the heart may respond with increased sympathetic stimulation, tachycardia and increased contractility. With the resistance against which the left ventricle is ejecting dramatically reduced, cardiac output may actually increase. [1,6]
Therefore, the classic early distributive pattern is:
Cardiac output ↑
Giving us:
EARLY SEPTIC/DISTRIBUTIVE SHOCK
Preload ↓ | Afterload ↓ | Cardiac Output ↑
This is the classic “warm shock” physiology. [1,6]
The patient can have warm extremities, bounding pulses and a relatively high cardiac output while still having profoundly abnormal tissue perfusion. [1,4,6]
That alone should remind us why cardiac output and blood pressure cannot independently tell us whether the tissues are receiving and utilizing oxygen appropriately. [1,2]
But septic shock is not static.
As the disease progresses, myocardial depression may develop. Intravascular volume may become increasingly depleted. Acidosis, hypoxemia and metabolic dysfunction may further impair cardiovascular performance. [6]
The patient who initially had a high cardiac output may eventually develop:
Cardiac output ↓ [4,6]
So writing “cardiac output is increased in septic shock” without qualification misses the point.
It may be increased.
The patient’s physiology determines the answer.
Obstructive Shock: The Pump Cannot Move Blood Through the Circuit
Obstructive shock creates another interesting physiological situation.
The myocardium itself may initially be capable of functioning normally, and circulating blood volume may be adequate.
But something physically prevents blood from moving effectively through the cardiovascular system. [1,4]
Classic causes include: [1,4]
- Massive pulmonary embolism
- Cardiac tamponade
- Tension pneumothorax
In each case, the mechanism is different, but the final result is similar:
Forward blood flow is impaired.
Therefore:
Cardiac output ↓ [1,4]
Preload becomes more complicated.
This is where simply memorizing “preload up” or “preload down” can become misleading.
Consider a massive pulmonary embolism.
The right ventricle encounters a sudden increase in pulmonary vascular resistance. Right ventricular afterload rises dramatically. The RV dilates and begins to fail. [7]
Right-sided pressures rise.
But less blood reaches the left side of the heart.
So the patient may simultaneously have:
Elevated right-sided filling pressures
and
Reduced left ventricular preload. [7]
Cardiac tamponade produces another mechanism. Increasing pericardial pressure restricts ventricular filling. Venous pressures rise because blood cannot effectively enter the heart, yet actual ventricular filling is impaired. [4,8]
Tension pneumothorax can similarly reduce venous return through increased intrathoracic pressure while also increasing right ventricular outflow resistance. [4]
The important concept is therefore not simply whether “preload” is high or low.
It is:
Where is the obstruction, and what is happening to blood flow before and after it?
Systemically, the body again responds to falling cardiac output with sympathetic vasoconstriction. [1,4]
Therefore:
Afterload/SVR ↑
A useful simplified pattern is:
OBSTRUCTIVE SHOCK
Effective LV preload ↓ | Afterload ↑ | Cardiac Output ↓
Often accompanied by elevated right-sided filling pressures, depending on the cause. [7,8]
Put the Patterns Together
The classic hemodynamic patterns can therefore be summarized as: [1,2,4]
| Shock Type | Preload | Afterload/SVR | Cardiac Output |
|---|---|---|---|
| Hypovolemic | ↓ | ↑ | ↓ |
| Cardiogenic | ↑ | ↑ | ↓ |
| Distributive — early | ↓ | ↓ | ↑ |
| Obstructive | ↓ effective LV preload* | ↑ | ↓ |
*Right-sided filling pressures may be elevated depending on the location and mechanism of obstruction.
This table is useful.
But it should not become another algorithm to memorize.
Because real patients don’t always read the textbook.
The Patient in Front of You May Not Follow the Table
These patterns describe expected physiology.
They are not immutable rules. [1,2]
A septic patient with severe cardiomyopathy may have a low cardiac output rather than a high one. [6]
A patient with cardiogenic shock who has received aggressive diuresis may not present with dramatically elevated filling pressures.
A hemorrhagic patient who has received significant resuscitation may look very different from the same patient twenty minutes earlier.
A patient with massive pulmonary embolism may have markedly elevated right-sided pressures while simultaneously having an underfilled left ventricle. [7]
Mechanical ventilation, PEEP, medications, fluid administration, vasopressors and progression of the underlying disease can all change the hemodynamic picture. [2]
Shock is dynamic.
We should therefore stop asking:
“What are the numbers supposed to be?”
And start asking:
“What physiology would produce the numbers I am seeing?”
That is a very different way of thinking.
MAP Does Not Complete the Picture
This also explains why an acceptable mean arterial pressure does not necessarily mean adequate perfusion. [1,2]
At its simplest:
MAP is influenced by cardiac output and systemic vascular resistance.
A patient can therefore maintain an acceptable MAP because systemic vascular resistance has increased significantly even while cardiac output is falling. [1,2]
The monitor may show a MAP of 70 mmHg.
That number can look reassuring.
But if the patient’s extremities are cold, capillary refill is prolonged, mental status is deteriorating, urine output is falling and lactate is increasing, the tissues may be telling you something very different. [1,2]
The pressure exists.
The perfusion may not.
This is why hemodynamic assessment cannot end with a blood pressure. [1,2]
Stop Memorizing the Arrows
It is useful to know the expected hemodynamic patterns of shock.
But memorization should never replace understanding.
Instead, think through the circulation.
If the tank is empty, preload falls.
If the pump fails, blood backs up and forward flow falls.
If the vessels lose their tone, afterload falls.
If something obstructs circulation, blood cannot effectively move through the circuit.
Once you understand those mechanisms, you no longer need to desperately remember whether an arrow is supposed to point upward or downward.
You can work it out.
And more importantly, when the patient doesn’t follow the textbook pattern, you can work out why.
That is where physiology becomes more valuable than memorization.
Because the goal isn’t to identify an arrow on an exam.
The goal is to stand in front of a deteriorating patient, recognize what is failing, understand why it is failing and choose an intervention that actually addresses the physiology.
Treat the patient. Understand the physiology. Then make the numbers make sense.
AGC Med — Knowing what isn’t enough. You must know why.
References
1. Vincent JL, De Backer D. Circulatory shock. N Engl J Med. 2013;369(18):1726–1734. doi:10.1056/NEJMra1208943.
2. Cecconi M, De Backer D, Antonelli M, et al. Consensus on circulatory shock and hemodynamic monitoring. Task force of the European Society of Intensive Care Medicine. Intensive Care Med. 2014;40(12):1795–1815. doi:10.1007/s00134-014-3525-z.
3. Procter LD, Spain DA. Overview of heart failure: cardiovascular physiology—preload, afterload, cardiac output and the Frank-Starling relationship. Merck Manual Professional Edition. Updated 2026.
4. Procter LD, Spain DA. Shock. Merck Manual Professional Edition. Updated June 2026.
5. van Diepen S, Katz JN, Albert NM, et al. Contemporary management of cardiogenic shock: a scientific statement from the American Heart Association. Circulation. 2017;136(16):e232–e268. doi:10.1161/CIR.0000000000000525.
6. MacKenzie IM. The haemodynamics of human septic shock. Anaesthesia. 2001;56(2):130–144. doi:10.1046/j.1365-2044.2001.01866.x.
7. Konstantinides SV, Meyer G, Becattini C, et al. 2019 ESC Guidelines for the diagnosis and management of acute pulmonary embolism developed in collaboration with the European Respiratory Society. Eur Heart J. 2020;41(4):543–603. doi:10.1093/eurheartj/ehz405.
8. Adler Y, Charron P, Imazio M, et al. 2015 ESC Guidelines for the diagnosis and management of pericardial diseases. Eur Heart J. 2015;36(42):2921–2964. doi:10.1093/eurheartj/ehv318.